US Natural Gas Storage Builds to 1,970 BCF — 6% Above the Five-Year Average — as Henry Hub Softens to $2.64
EIA's April 17 Weekly Natural Gas Storage Report shows Lower-48 working gas inventories at 1,970 billion cubic feet as of April 10, about 115 BCF above the five-year average for the same week. Henry Hub spot prices slipped to $2.64/MMBtu on April 10 from $3.04 on April 6.
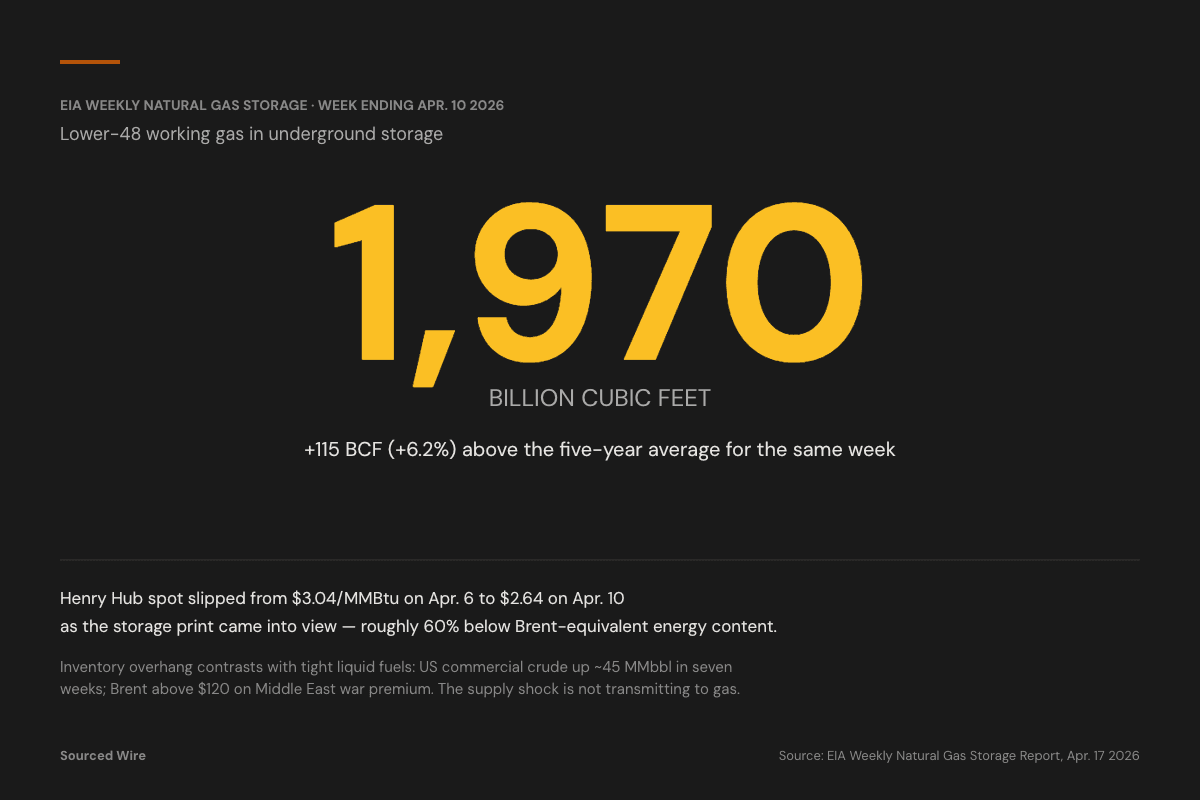
US Lower-48 natural gas in underground storage rose to 1,970 billion cubic feet for the week ending April 10, up 59 BCF from the previous week, according to the Energy Information Administration's April 17 Weekly Natural Gas Storage Report. That's roughly 6% above the five-year average for the same calendar week.
The April 10 injection falls within typical early-injection-season behavior — US gas storage begins rebuilding every spring as heating demand ends and power-sector demand hasn't yet peaked — but the absolute inventory level places the market on the loose side of normal at a moment when the liquid-fuels complex (crude, gasoline, diesel) is trading tight on Middle East-war-driven risk premium.
The numbers
| Week ending | Lower-48 working gas (BCF) |
|---|---|
| April 10, 2026 | 1,970 |
| April 3, 2026 | 1,911 |
| March 27, 2026 | 1,861 |
| March 20, 2026 | 1,829 |
| March 13, 2026 | 1,883 |
| Same week, prior years | BCF |
|---|---|
| April 11, 2025 | 1,846 |
| April 12, 2024 | 2,333 |
| April 7, 2023 | 1,855 |
| April 8, 2022 | 1,397 |
| April 9, 2021 | 1,845 |
| Five-year average | 1,855 |
| April 10, 2026 | 1,970 |
| vs five-year average | +115 BCF (+6.2%) |
Regional breakdown (April 10, 2026)
| Region | Working gas (BCF) |
|---|---|
| South Central | 839 |
| Midwest | 371 |
| East | 283 |
| Pacific | 267 |
| Mountain | 210 |
Within the South Central region, the salt-dome subset — a key source of quick-cycling supply — sits at 243 BCF, up from 226 BCF one week earlier.
Prices
Henry Hub spot prices softened into the storage print. EIA daily spot data:
| Date | Henry Hub ($/MMBtu) |
|---|---|
| April 6, 2026 | 3.04 |
| April 7, 2026 | 3.01 |
| April 8, 2026 | 2.78 |
| April 9, 2026 | 2.78 |
| April 10, 2026 | 2.64 |
| April 13, 2026 | 2.79 |
The ~40-cent drop from April 6 to April 10 tracks the market's adjustment to the rising injection-season print. At $2.64/MMBtu, Henry Hub is ~60% below Brent crude's equivalent energy content, one of the wider oil-to-gas value ratios of the past three years.
Context
The divergence between tight crude (commercial crude +45 MMbbl over seven weeks, SPR drawing ~6 MMbbl in three weeks, WTI around $100, Brent above $120) and loose natural gas (storage 6% above seasonal norm, Henry Hub below $3) reflects the geographic footprint of the current supply shock. Middle East disruption transmits quickly through seaborne crude flows but only weakly through piped and LNG gas, where the US is a net exporter and domestic production growth has outpaced winter heating demand and LNG export capacity adds.