Earth Got 16% Brighter at Night Over Nine Years, but the Real Story Is Where It Went Dark
A Nature study analyzing over a million daily NASA satellite images found that brightening and dimming are intensifying simultaneously worldwide -- with war, energy policy, and oil drilling cycles all visible from space.
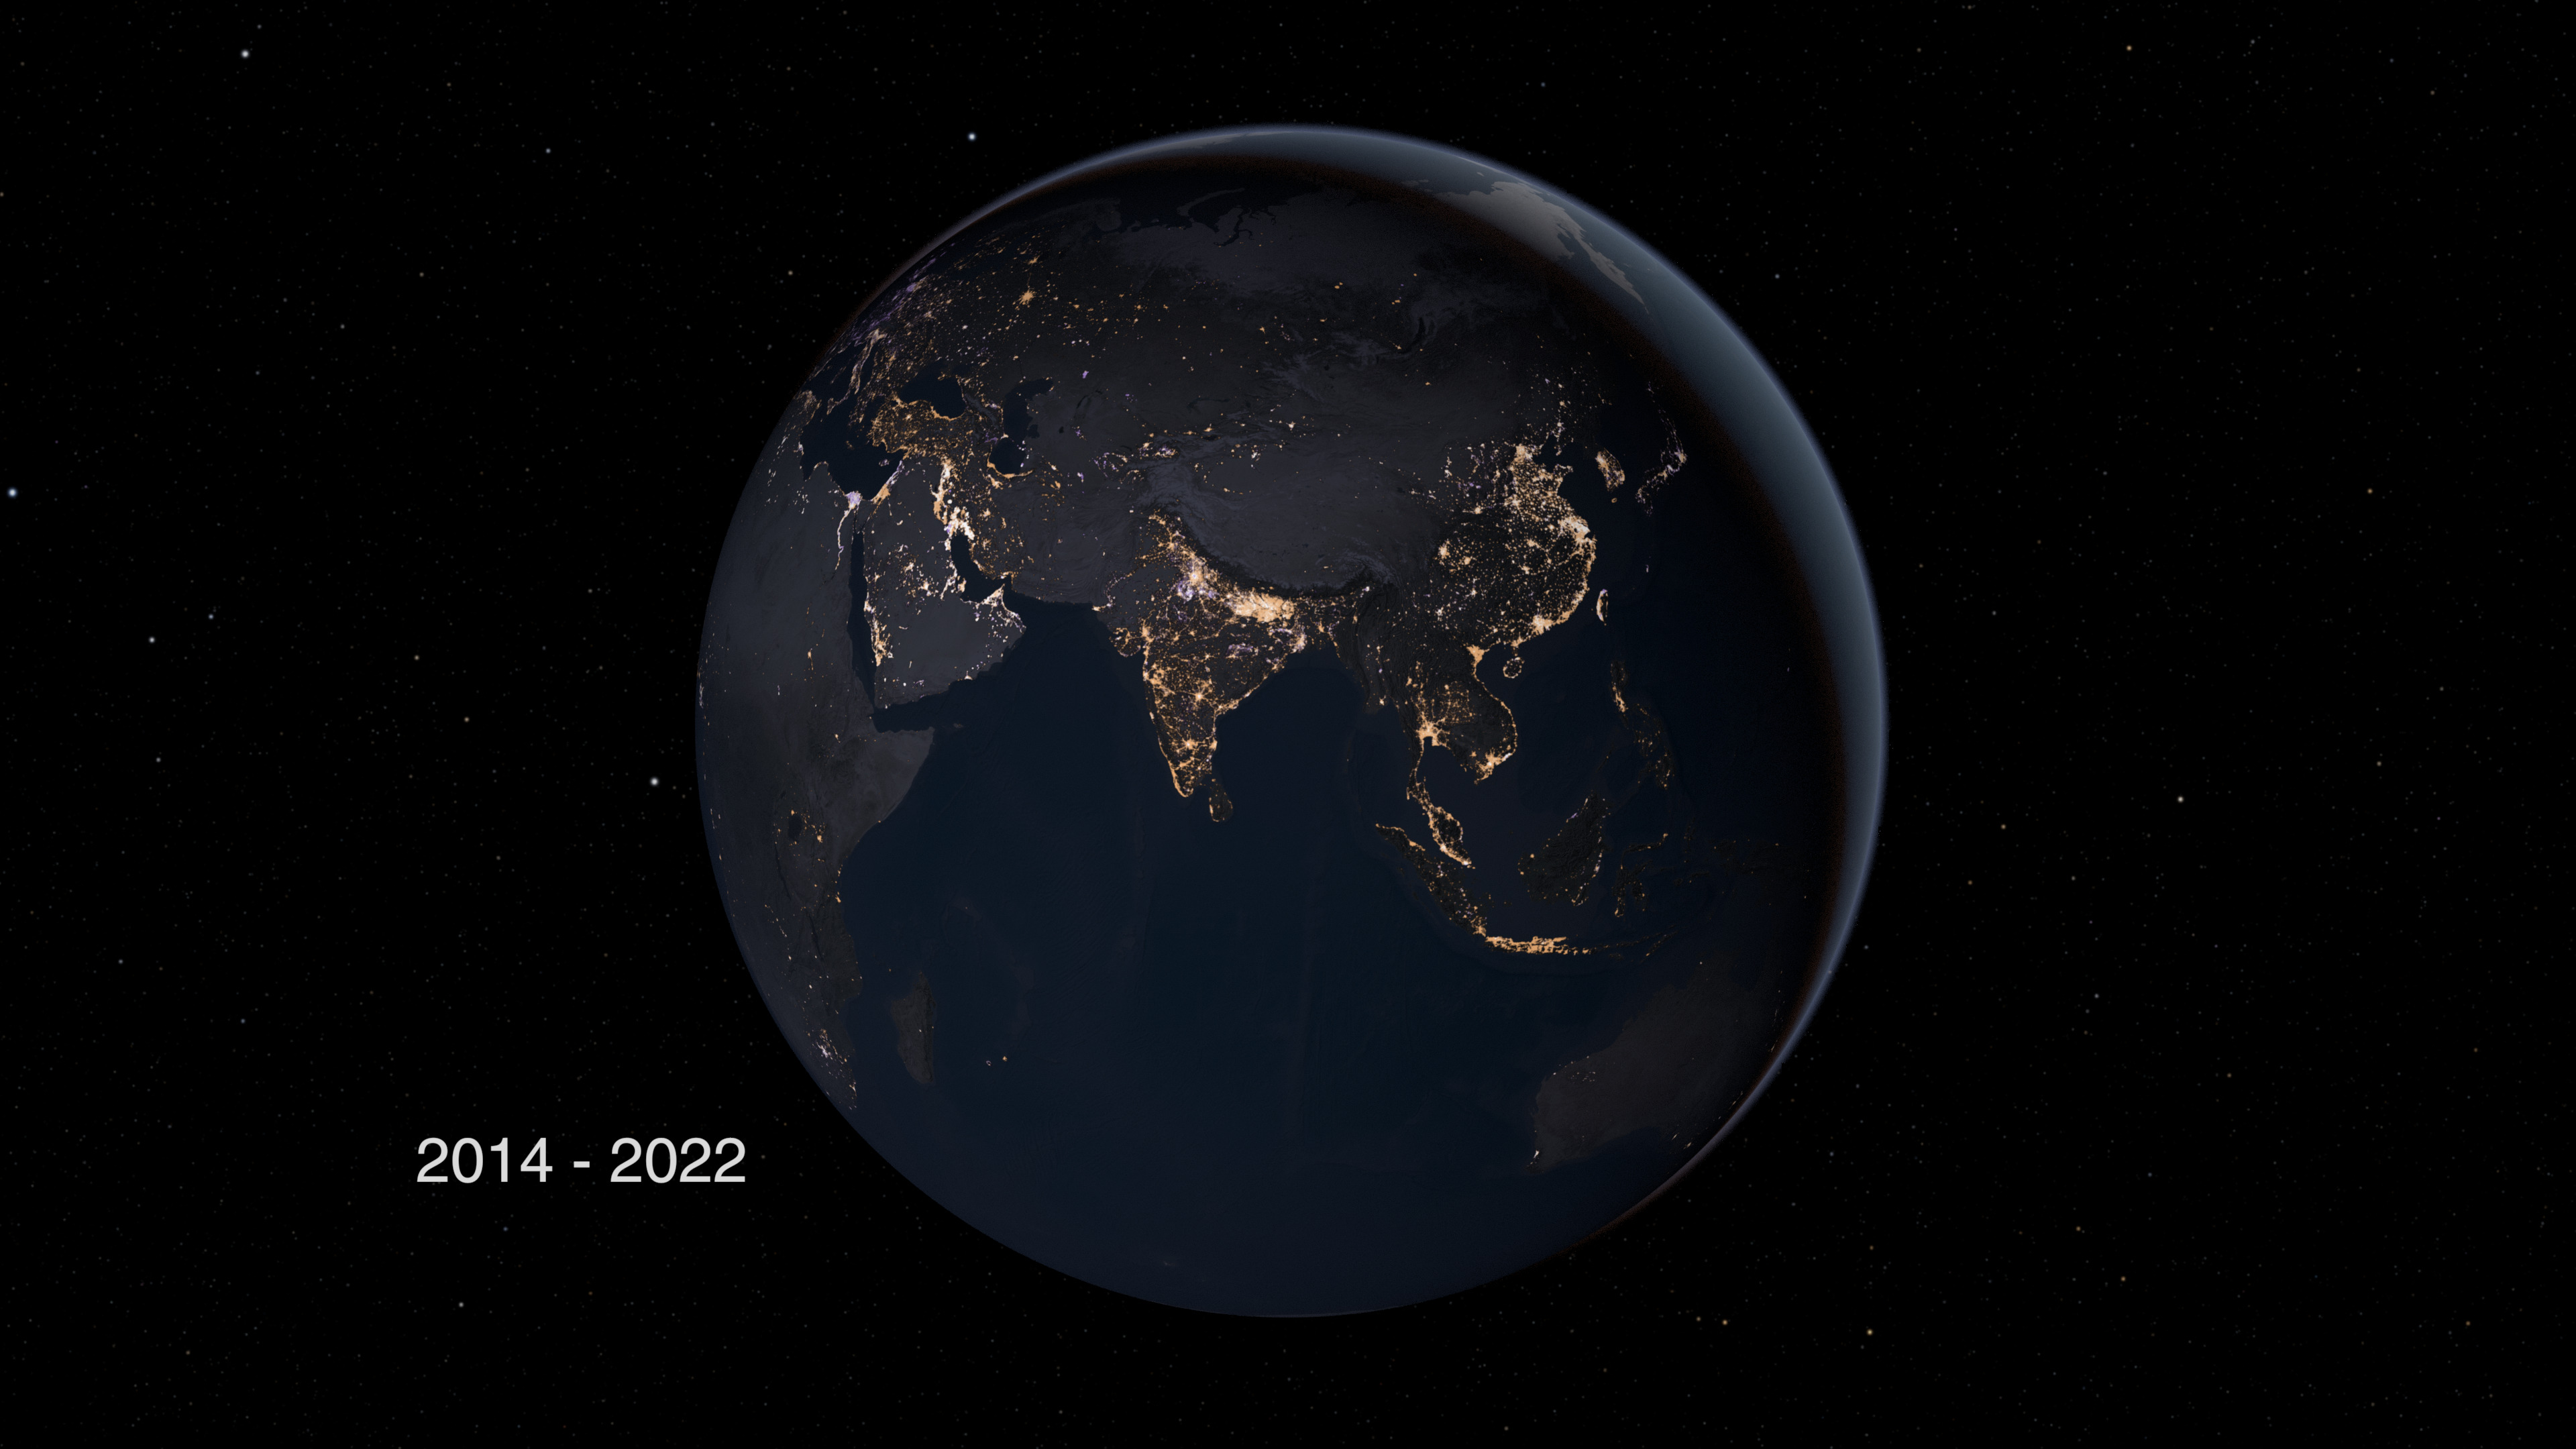
Earth's artificial light increased 16% between 2014 and 2022. But that net number masks something more revealing: the planet's nighttime glow is not steadily expanding. It is flickering -- brightening in some places, dimming in others, and doing both with increasing intensity.
A team of researchers led by Tian Li at the University of Connecticut analyzed more than a million daily images from NASA's Black Marble satellite system, the first global study to use full-resolution nightly data rather than monthly or annual composites. Their findings, published April 8 in Nature, turn nighttime light into what one researcher called an "electrocardiogram" for human civilization.
The numbers
Areas that brightened added radiance equivalent to 34% of the 2014 global baseline. Areas that dimmed offset that by 18%. The net: a 16% increase, or roughly 2% per year.
But the average illuminated patch of land changed its nighttime brightness 6.6 times over the nine-year period. This is not a planet getting uniformly brighter. It is a planet in constant flux.
Where the lights went out
The most striking finding is where Earth got darker.
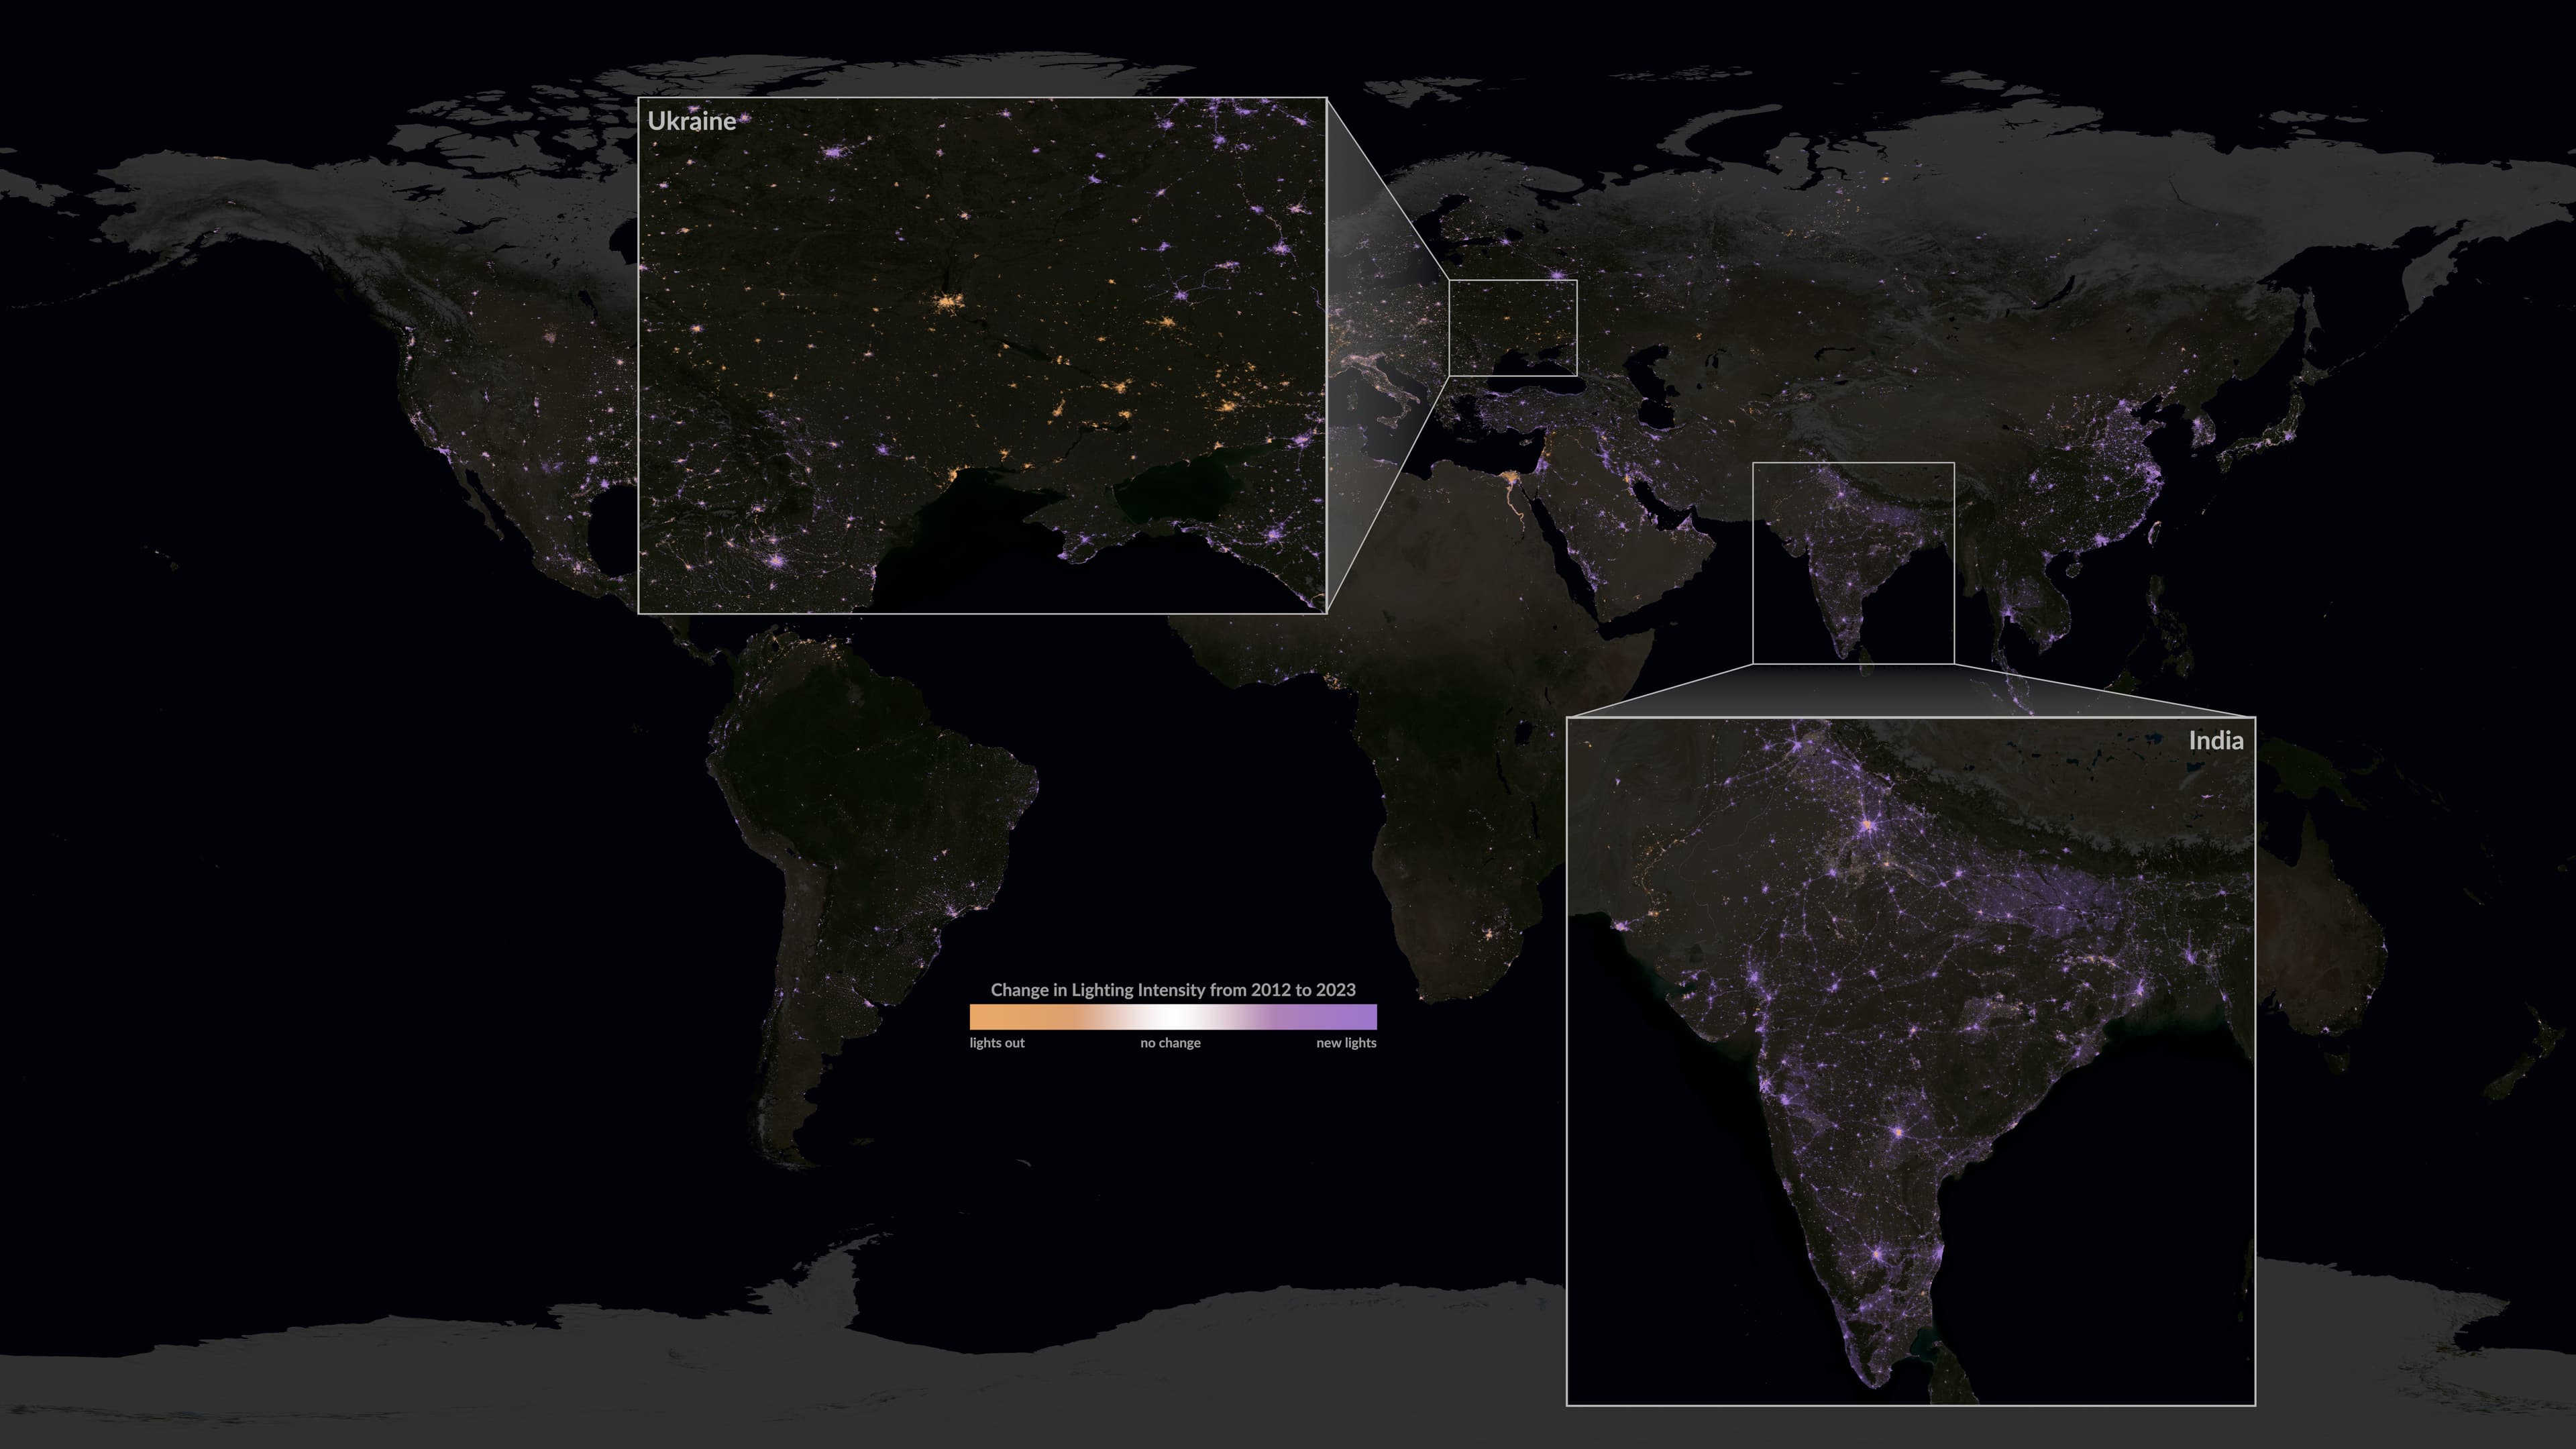
Europe dimmed overall by 4%. France led with a 33% reduction in nighttime light -- the result of municipal streetlight shutoffs after midnight, enacted as energy-saving and light-pollution policy. The United Kingdom dropped 22%, the Netherlands 21%. The reductions follow national borders precisely, pointing to country-specific regulation rather than organic economic change.
Germany was nearly flat: brightening areas gained 8.9% while dimming areas lost 9.2%, producing a statistical wash that masks significant regional restructuring.
Ukraine showed dramatic dimming after Russia's 2022 invasion. The daily resolution allowed researchers to trace power outages city by city as the war unfolded.
Venezuela dimmed sharply, tracking the country's economic collapse.
Where the lights got brighter
China and India drove much of the global brightening, with rapid urbanization and electrification lighting up expanding cities.
The United States showed a split pattern. The West Coast brightened while parts of the East Coast and Midwest dimmed -- likely reflecting shifts in older urban centers and LED adoption. But the most volatile American lights were in the oil fields: the Permian Basin in Texas and North Dakota's Bakken Formation flickered violently with drilling boom-and-bust cycles, their light patterns disconnected from broader economic indicators.
In early 2020, a synchronized global dip in radiance corresponded precisely with COVID-19 lockdowns. In late 2022, Belgium and France dimmed again as European governments enacted emergency energy-conservation measures during the energy crisis.
How they did it
Previous nighttime light studies relied on monthly or annual composites, smoothing out the very volatility that turns out to be the signal. This team used daily observations from the VIIRS Day/Night Band instrument aboard three satellites -- Suomi NPP, NOAA-20, and NOAA-21 -- which observe between 1 and 4 AM local time at a resolution of roughly 0.5 square kilometers per pixel.
For the first time, they also corrected for satellite viewing angle, recognizing that artificial light appears differently depending on the observation angle -- a methodological advance that made the daily comparisons meaningful.
Why it matters
"Light is still a powerful proxy, but it is no longer linear," the researchers conclude. A dimming city in Europe and a dimming city in a conflict zone look the same from space but mean entirely different things. The study argues that interpreting nighttime light now requires classifying the type of change -- stable growth, volatility, or structural dimming -- rather than simply measuring direction.
The practical implications extend beyond science. Nighttime satellite data is already used by economists to estimate GDP in countries with unreliable statistics, by humanitarian organizations to track conflict impacts, and by energy analysts to monitor industrial activity. This study suggests those applications need to account for volatility, not just trend.