March CPI Jumps 0.9% on Record Gasoline Surge; Core Inflation Holds at 2.6%
Headline U.S. consumer prices rose 0.9% in March — their biggest monthly gain in years — driven almost entirely by a 21.2% spike in the gasoline index, the largest monthly increase in the 59-year history of the series. Core inflation stayed steady at 2.6% year-over-year.
The Consumer Price Index for All Urban Consumers rose 0.9 percent in March on a seasonally adjusted basis, the Bureau of Labor Statistics reported, up from 0.3 percent in February. Over the last 12 months the all-items index climbed 3.3 percent before seasonal adjustment, up from 2.4 percent in the 12 months ending February. It is the sharpest one-month acceleration in the headline rate in more than a year.
Almost all of the increase came from energy. The BLS energy index rose 10.9 percent in March — the largest monthly jump since September 2005 — with the gasoline sub-index surging 21.2 percent, "the largest monthly increase since the series was first published in 1967." Gasoline alone accounted for nearly three quarters of the monthly all-items increase, BLS said. Fuel oil rose 30.7 percent, its largest monthly gain since February 2000.
Core inflation — the all-items index excluding food and energy — rose just 0.2 percent in March, matching February, and 2.6 percent over the last 12 months. The food index was unchanged for the month.
Headline vs. core
| Measure | MoM (SA) | YoY (NSA) |
|---|---|---|
| All items | +0.9% | +3.3% |
| All items less food and energy (core) | +0.2% | +2.6% |
| Food | 0.0% | +2.7% |
| Energy | +10.9% | +12.5% |
| Gasoline (all types) | +21.2% | +18.9% |
| Fuel oil | +30.7% | +44.2% |
| Electricity | +0.8% | +4.6% |
| Shelter | +0.3% | +3.0% |
| New vehicles | +0.1% | +0.5% |
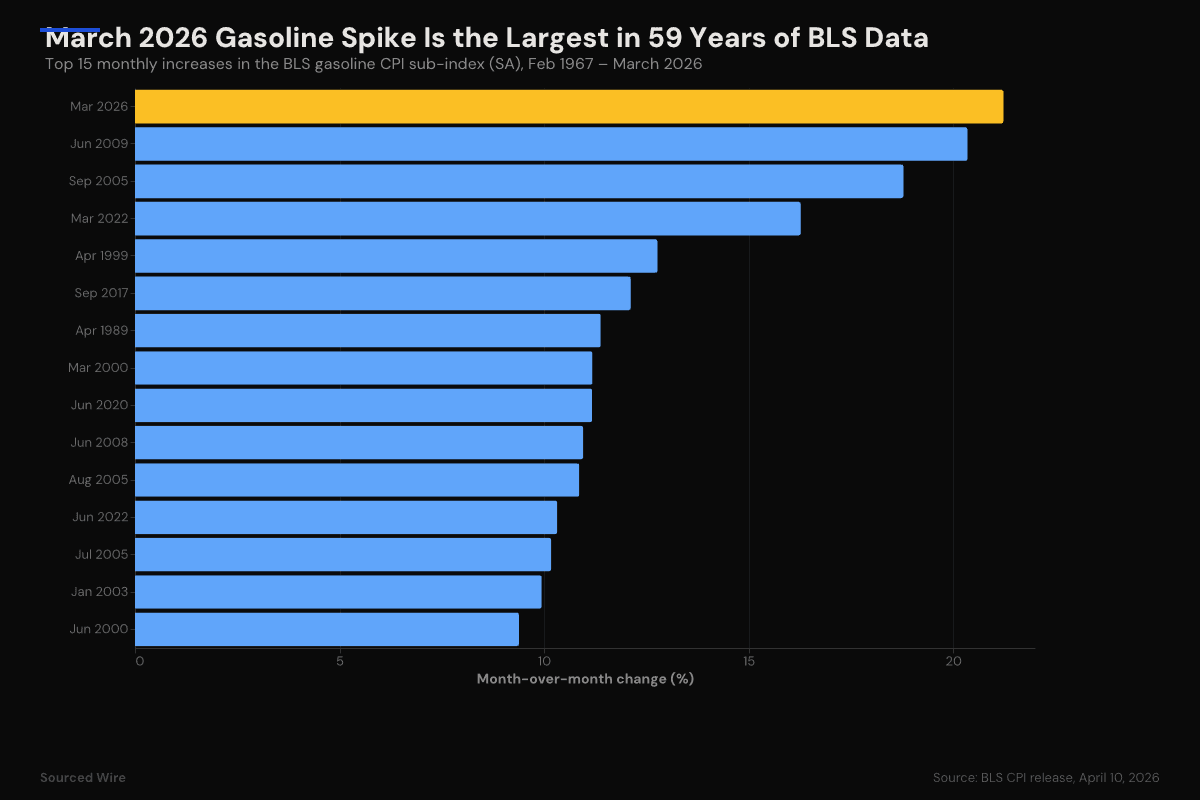
How rare the gasoline move is
BLS began publishing the gasoline CPI sub-index in February 1967. Across 710 monthly observations since then, March 2026's +21.2 percent move is the single largest on record, edging out June 2009's +20.4 percent rebound from the post-Lehman crash.
| Rank | Month | MoM change |
|---|---|---|
| 1 | Mar 2026 | +21.2% |
| 2 | Jun 2009 | +20.4% |
| 3 | Sep 2005 | +18.8% |
| 4 | Mar 2022 | +16.3% |
| 5 | Apr 1999 | +12.8% |
| 6 | Sep 2017 | +12.1% |
| 7 | Apr 1989 | +11.4% |
| 8 | Mar 2000 | +11.2% |
| 9 | Jun 2020 | +11.2% |
What else moved
Away from the energy shock, price pressure was concentrated in a handful of services: airline fares rose 2.7 percent on the month after a 1.4 percent gain in February, and the apparel index rose 1.0 percent. The shelter index increased 0.3 percent as owners' equivalent rent also rose 0.3 percent and rent rose 0.2 percent. Medical care fell 0.2 percent after rising 0.5 percent in February, with prescription drugs down 1.5 percent. Used cars and trucks fell 0.4 percent for a fourth consecutive month. Food away from home rose 0.2 percent while food at home fell 0.2 percent; the egg index declined 3.4 percent for the month.
Note on missing data
BLS did not publish October or November 2025 CPI data because of the 2025 lapse in appropriations. Those two months are blank in the official monthly changes table. Year-over-year comparisons use March 2025 as the base, which is unaffected.
The April 2026 CPI release is scheduled for May 12, 2026, at 8:30 a.m. ET.