Bond Market Sees the Oil Shock as Transitory: 5Y5Y Forward Inflation Stays at 2.16% Despite Brent Above $120
The Federal Reserve Bank of St. Louis's daily FRED updates as of April 17 show the 5-year, 5-year forward inflation expectation rate at 2.16% — essentially unchanged from 2.11% one year ago, despite the Middle East war driving Brent crude above $120 and US gasoline to $4.25/gal. Long-horizon market-implied inflation is behaving as if the shock will not persist.
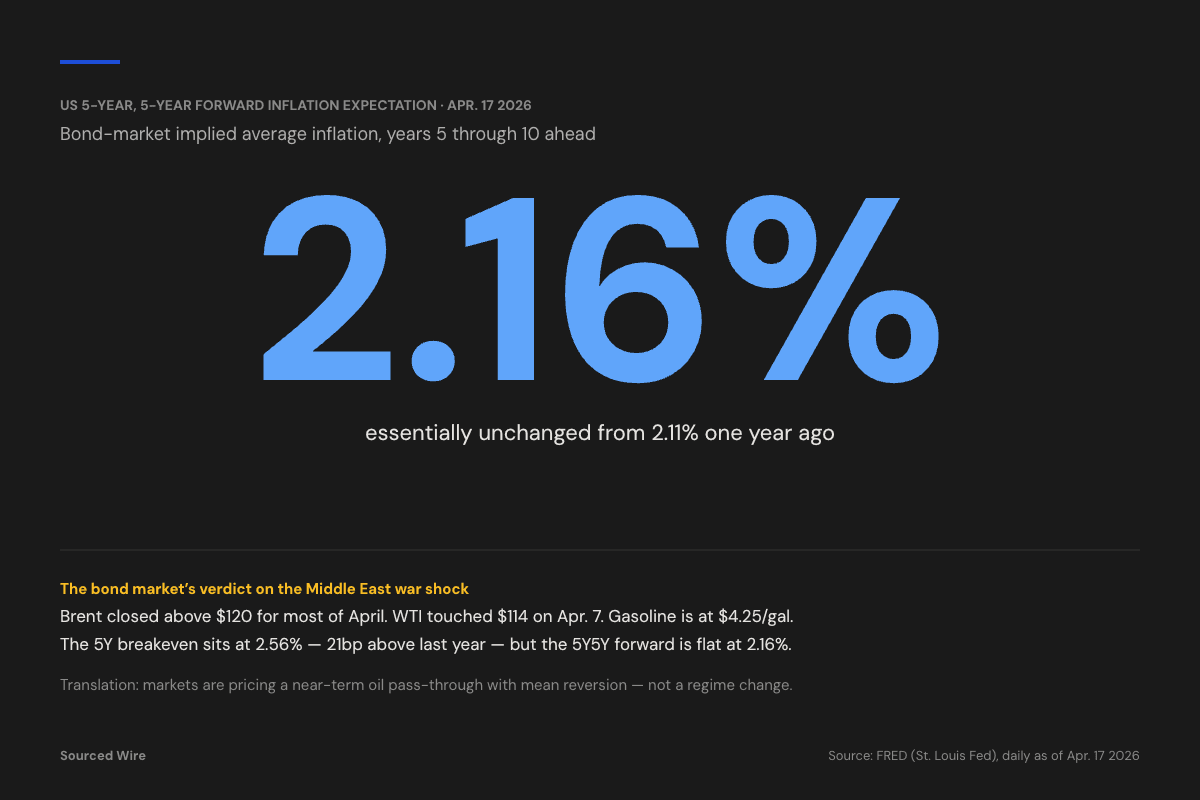
Long-run market-implied inflation expectations have barely moved over the past year, even as the Middle East war has pushed Brent crude above $120 per barrel and US regular gasoline to $4.25 per gallon.
According to FRED data updated Friday, April 17, 2026:
| Series | Apr. 17 2026 | 1 month ago | 3 months ago | 1 year ago |
|---|---|---|---|---|
| 5Y, 5Y Forward Inflation Expectation (T5YIFR) | 2.16% | 2.14% | 2.22% | 2.11% |
| 5-Year Breakeven Inflation (T5YIE) | 2.56% | 2.66% | 2.36% | 2.35% |
| 10-Year Breakeven Inflation (T10YIE) | 2.36% | 2.40% | 2.29% | 2.23% |
The 5-year, 5-year forward rate — the Fed's preferred gauge of long-horizon expectations, representing average expected inflation over the five years starting five years from today — sits within 5 basis points of its year-ago level.
Why that's notable
In the same 12-month window, the supply-side shocks that would historically re-anchor inflation expectations higher were large:
- Brent crude has traded in a range that touched $138 per barrel on April 7 and has closed above $119 for most of April.
- West Texas Intermediate closed at $100.72 on April 13, with a one-day move of -$18 between April 7 and April 8 (from $114.58 to $96.17).
- US regular gasoline averaged $4.254/gal for the weeks ending April 6 and April 13, up from $3.057/gal in mid-February.
- The Federal Reserve held its policy rate at 3.64% through Q1 2026 with FOMC members split between cut and hike advocacy.
The 5Y breakeven is the only market-implied gauge showing meaningful movement, at 2.56% versus 2.35% a year ago — a 21 basis point increase. That captures the near-term oil pass-through. The forward curve shape — 5Y breakeven at 2.56%, falling to 2.16% for the 5Y5Y forward — tells the rest of the story: markets are pricing near-term inflation above target but then reversion.
Nominal yields
| Series | Apr. 16 2026 | 1 month ago | 3 months ago | 1 year ago |
|---|---|---|---|---|
| 10-Year Treasury (DGS10) | 4.32% | 4.20% | 4.18% | 4.48% |
| 2-Year Treasury (DGS2) | 3.78% | 3.68% | 3.53% | 3.96% |
| 10Y–2Y spread (T10Y2Y) | +55 bp | +52 bp | +65 bp | +52 bp |
The curve has steepened modestly over the month but is within its year-ago range. The 10-year at 4.32% is actually 16 basis points lower than one year ago, consistent with a market that has priced the oil shock as a supply story rather than a demand-accelerant.
Context
The FRED series above are market-priced derivatives of Treasury and Treasury Inflation-Protected Securities (TIPS) yields. They do not reflect survey-based consumer expectations, which have behaved differently — the University of Michigan's 1-year inflation expectation series is the usual counterweight and tends to react more strongly to gasoline prices. What the bond market is revealing is the view of institutional investors with hedged, collateral-backed positions: that the current energy complex price environment will not compound into a persistent inflation regime.
That view is conditioned on a specific assumption embedded in both the IMF's April 2026 World Economic Outlook and its April 15 Fiscal Monitor: that the Middle East war's disruption eases by mid-2026. The IMF's severe scenario — oil 100% higher than baseline through 2027 — would push realized inflation meaningfully higher than the 5Y breakeven currently implies.