S&P 500 Back to $679 as Nasdaq Completes Full Recovery; AVGO +18% and AMZN +12% Since Monday, MSFT and TSLA Still Underwater
The S&P 500 closed Friday April 10 at $679.35, erasing the remainder of its March drawdown as the post-ceasefire risk-on rally concentrated in Broadcom, Amazon, Google and Meta. Eight of eleven S&P sectors are positive since the April 6 low, but energy is down 4.6% as Brent crude fell 13.6% in a single week.
The S&P 500 ETF (SPY) closed at $679.35 on Friday, April 10, effectively completing its recovery from the March drawdown that bottomed on March 30. SPY is now just 0.8% below its early-March level of $685.13 after gaining another 3.1% from the $658.88 close on April 6 — the starting point of this article's original reporting.
The headline index number masks an unusual dispersion underneath: eight of eleven S&P 500 sectors moved higher in the four trading days from Monday April 6 to Friday April 10, but the gains are concentrated in a handful of mega-caps and the losses are concentrated in energy.
Updated index performance
| Index | Early March | March 30 low | April 6 close | April 10 close | vs. Apr 6 | vs. March high |
|---|---|---|---|---|---|---|
| SPY (S&P 500) | $685.13 | $629.29 | $658.88 | $679.35 | +3.1% | -0.8% |
| QQQ (Nasdaq 100) | $610.58 | $555.60 | $588.40 | $611.15 | +3.9% | +0.1% |
| DIA (Dow) | $487.72 | $450.47 | $466.69 | $479.26 | +2.7% |
The Nasdaq 100 is the first of the major indices to fully round-trip the correction: QQQ closed Friday at $611.15, 0.1% above its early-March level. The Russell 2000 (IWM) is within 0.2% of its early-March close. The Dow is the laggard, still 1.7% below where it started March.
Mega-cap dispersion is the story
| Stock | April 6 | April 10 | 4-day return | From March high | Still below March? |
|---|---|---|---|---|---|
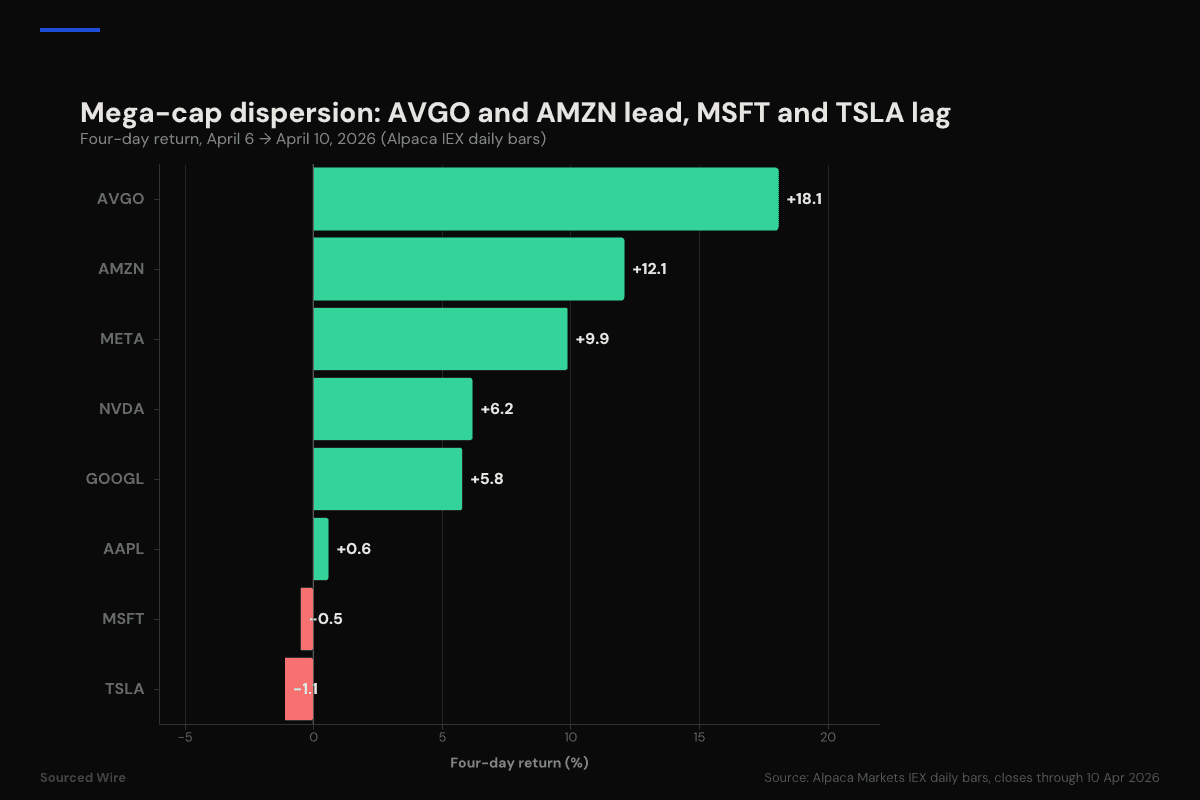
| AVGO (Broadcom) | $314.48 | $371.44 | +18.1% | +11.7% | no — new high |
| AMZN (Amazon) | $212.76 | $238.42 | +12.1% | +8.9% | no — new high |
| META | $573.07 | $629.84 | +9.9% | -5.7% | yes |
| NVDA | $177.59 | $188.61 |
Broadcom's 18% four-day move is the standout: AVGO priced in both the China chip export headwind reversal and the AI capex rebound, and closed Friday at a new all-time high. Amazon and Google also printed new highs for the year. The weight of the rally in these four names (AVGO, AMZN, GOOGL, META) is what dragged the Nasdaq back above its March peak while the S&P 500 is still 0.8% short.
Microsoft and Tesla, by contrast, did not participate in the rebound: MSFT closed slightly down for the week and remains 9.7% below its early-March level. TSLA is 14.1% below early March and has essentially gone sideways since the April 6 low.
Sectors: eight green, three red
| Sector ETF | 4-day return (Apr 6 → Apr 10) | vs. early March |
|---|---|---|
| XLK (Technology) | +4.2% | +1.7% |
| XLI (Industrials) | +4.2% | -2.6% |
| XLY (Consumer Discretionary) | +3.5% | -3.1% |
| XLB (Materials) | +3.5% | 0.0% |
| XLRE (Real Estate) | +2.6% | -2.2% |
| XLC (Communications) | +2.0% | -4.1% |
| XLF (Financials) | +1.8% | -1.4% |
| XLU (Utilities) | +1.7% | -0.7% |
| XLV (Health Care) | +0.7% |
Energy is the only significant red sector and it is red for a specific reason: the Iran ceasefire announced earlier in the week unwound the "war premium" that had been priced into crude. United States Oil Fund (USO) fell 10.2% between April 6 and April 10, from $138.91 to $124.81. Brent (via BNO) fell 13.6% over the same four sessions, from $54.67 to $47.24. The energy equities followed: ConocoPhillips -6.1%, Exxon -5.1%, Chevron -5.2%, Occidental -7.9%, Phillips 66 -9.6%.
XLE is still 0.7% above its early-March level because it had rallied almost 20% on the way up during the conflict. The 4.6% weekly decline is the unwind, not a structural move.
What the data shows
The dispersion matters more than the headline index level. A market where the Nasdaq is at new highs, Broadcom is up 18% in four sessions, Microsoft is still 10% underwater and energy is dumping 5% in a week is not a uniform "risk-on" tape — it is a very specific rotation back into a narrow group of AI-exposed mega-caps while the ceasefire flushes out the war-premium trade. The S&P 500's 0.8% remaining gap to its early-March peak is almost entirely explained by MSFT's -9.7% drag and TSLA's -14.1% drag, both of which are at mega-cap weights in the index.