US National Debt Hits Record $39 Trillion, Up $2.7T in 12 Months
US total public debt hit a record $39.065 trillion on March 31, 2026, then dipped to $38.979T by April 17 as Treasury drew down issuance around the April 15 tax deadline — a seasonal pattern, not a trend change. Over the past 12 months, debt grew $2.762 trillion (+7.63%), adding roughly $6 billion in net new borrowing per day.
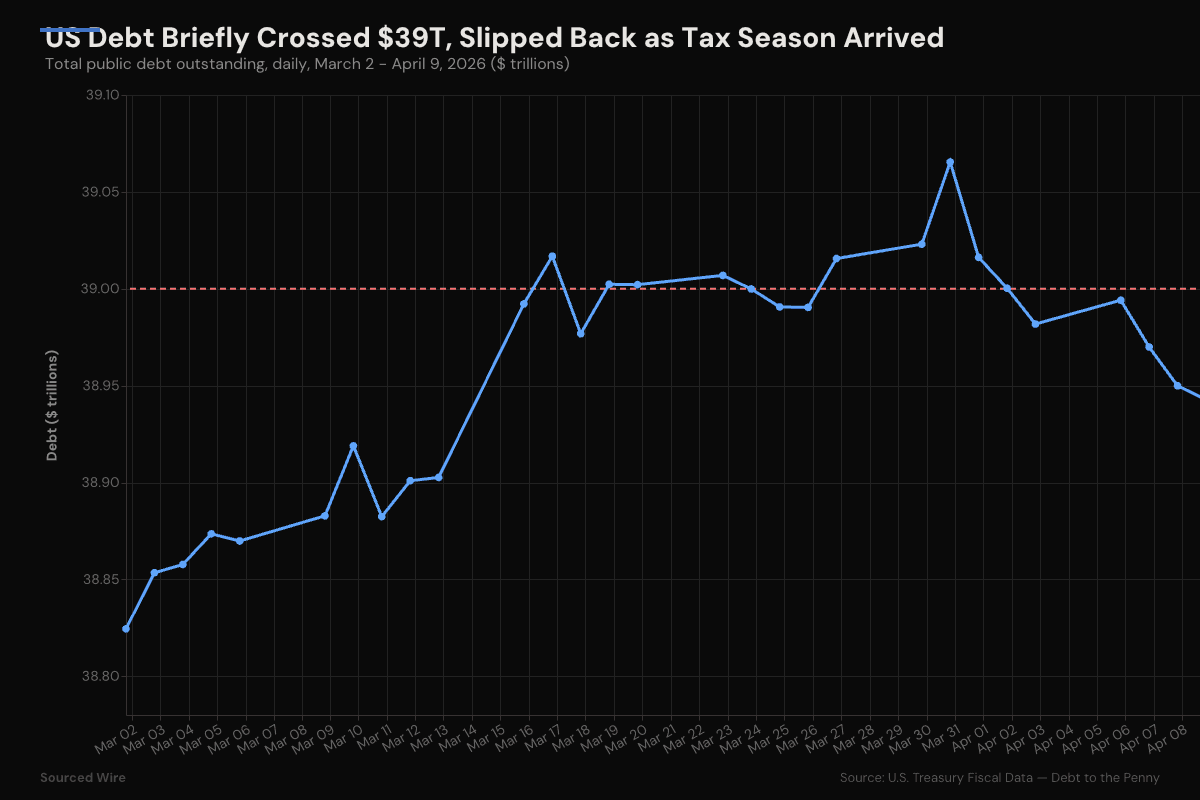
Total U.S. public debt outstanding crossed $39 trillion for the first time on March 17, 2026, peaked at $39.065 trillion on March 31, and has been trading in a narrow range just below that line ever since as the Treasury draws down issuance around the April 15 income-tax deadline. As of the April 17, 2026 Debt to the Penny release — the most recent available — the total stands at $38.979 trillion, roughly $86 billion below the March 31 peak.
Track the live number: The US National Debt tracker updates daily with the current total outstanding, 30-day trend, and year-over-year change.
In the dataset since the series was first published in 1993, the debt has spent exactly nine trading days at or above $39 trillion: March 17, 19, 20, 23, 27, 30, 31 and April 1, 2, before slipping back under the line on April 3 and staying there through April 17. The April 14 low of $38.933 trillion marked the tax-season trough; debt has edged back up each day since as post-April-15 issuance resumes.
Why the debt dipped below $39T
This is a seasonal pattern, not a fiscal correction. U.S. individual income tax returns are due on April 15. In the two weeks leading up to the deadline, Treasury's General Account receives a surge of withholding and estimated-tax payments. Treasury uses that inflow to reduce short-term bill issuance and let maturing debt roll off without being replaced dollar-for-dollar, which mechanically shrinks the total outstanding — briefly — every April.
Once the seasonal bulge passes, the underlying trajectory resumes. Over the trailing 12 months (April 17, 2025 → April 17, 2026), public debt rose from $36.217 trillion to $38.979 trillion: +$2.762 trillion, or +7.63%. That is the fiscal signal that matters.
The monthly progression
| Date | Total Public Debt |
|---|---|
| April 17, 2026 | $38.979 T |
| March 31, 2026 | $39.065 T (peak) |
| February 27, 2026 | $38.770 T |
| January 30, 2026 | $38.521 T |
| December 31, 2025 | $38.514 T |
| November 28, 2025 | $38.396 T |
| October 31, 2025 | $38.040 T |
| April 17, 2025 | $36.217 T |
The five-month addition of roughly $1 trillion (Oct 31 → Mar 31) averages out to about $6.7 billion per day of net new borrowing.
What the government pays to borrow
As of the most recent Average Interest Rates release (March 31, 2026):
| Security Type | Avg. Rate |
|---|---|
| Treasury Bills | 3.702% |
| Treasury Notes | 3.212% |
| Treasury Bonds | 3.392% |
| TIPS | 0.999% |
| Floating Rate Notes | 3.628% |
| Total Marketable | 3.365% |
The blended marketable rate of 3.365% sits just below the Federal Reserve's Q1 2026 policy rate of 3.64%. As older, lower-coupon securities mature and roll over at current rates, interest expense continues to climb even without additional net borrowing.
Scale in context
At $38.979 trillion, the national debt is roughly 140% of annual GDP (approximately $28 trillion). The $2.762 trillion added over the past 12 months exceeds the entire annual discretionary spending on defense ($886 billion in FY2025). Net interest payments on the debt are now the single largest line item in the federal budget, surpassing defense spending for the first time in FY2025.
The next Monthly Statement of the Public Debt will be released in early May and is expected to show debt resuming its climb above $39 trillion as the seasonal tax-receipt bulge fades and Treasury ramps bill issuance back up. For the running daily figure, the US National Debt tracker will reflect each new release.